Alex Rivera | Logout

How to monitor Java memory usage?

Asked 2009-06-29T15:41:19.490
81

We have a j2ee application running on Jboss and we want to monitor its memory usage. Currently we use the following code

    System.gc();
    Runtime rt = Runtime.getRuntime();
    long usedMB = (rt.totalMemory() - rt.freeMemory()) / 1024 / 1024;
    logger.information(this, "memory usage" + usedMB);

This code works fine. That means it shows memory curve which corresponds to reality. When we create a big xml file from a DB a curve goes up, after the extraction is finished it goes down.
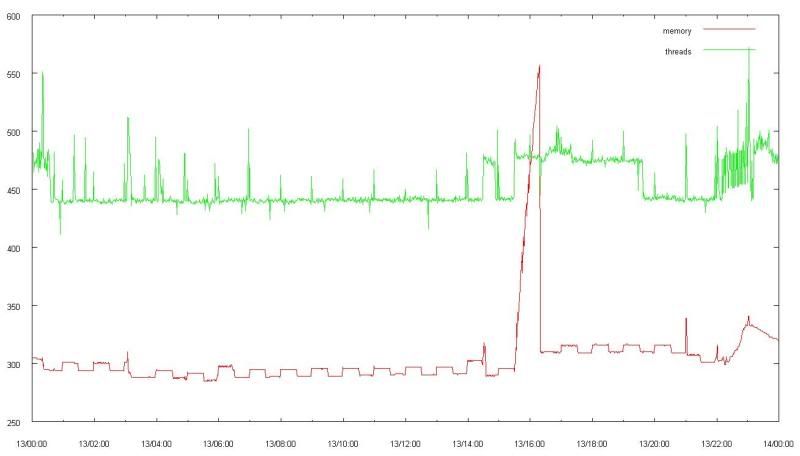
alt text

A consultant told us that calling gc() explicitly is wrong, "let jvm decide when to run gc". Basically his arguments were the same as disscussed here. But I still don't understand:

  • how can I have my memory usage curve?
  • what is wrong with the explicit gc()? I don't care about small performance issues which can happen with explicit gc() and which I would estimate in 1-3%. What I need is memory and thread monitor which helps me in analysis of our system on customer site.
Edit
Report

2 Answers

4

If you use java 1.5, you can look at ManagementFactory.getMemoryMXBean() which give you numbers on all kinds of memory. heap and non-heap, perm-gen.

A good example can be found there http://www.freshblurbs.com/explaining-java-lang-outofmemoryerror-permgen-space

answered 2009-06-29T15:57:29.957
2

If you use the JMX provided history of GC runs you can use the same before/after numbers, you just dont have to force a GC.

You just need to keep in mind that those GC runs (typically one for old and one for new generation) are not on regular intervalls, so you need to extract the starttime as well for plotting (or you plot against a sequence number, for most practical purposes that would be enough for plotting).

For example on Oracle HotSpot VM with ParNewGC, there is a JMX MBean called java.lang:type=GarbageCollector,name=PS Scavenge, it has a attribute LastGCInfo, it returns a CompositeData of the last YG scavenger run. It is recorded with duration, absolute startTime and memoryUsageBefore and memoryUsageAfter.

Just use a timer to read that attribute. Whenever a new startTime shows up you know that it describes a new GC event, you extract the memory information and keep polling for the next update. (Not sure if a AttributeChangeNotification somehow can be used.)

Tip: in your timer you might measure the distance to the last GC run, and if that is too long for the resulution of your plotting, you could invoke System.gc() conditionally. But I would not do that in a OLTP instance.

answered 2012-08-15T19:14:53.630

Your Answer