How to Create a Graph in Google Sheets
Open the Google Sheets page.. Click Blank.. Create your headers.
Steps
1
Open the Google Sheets page.
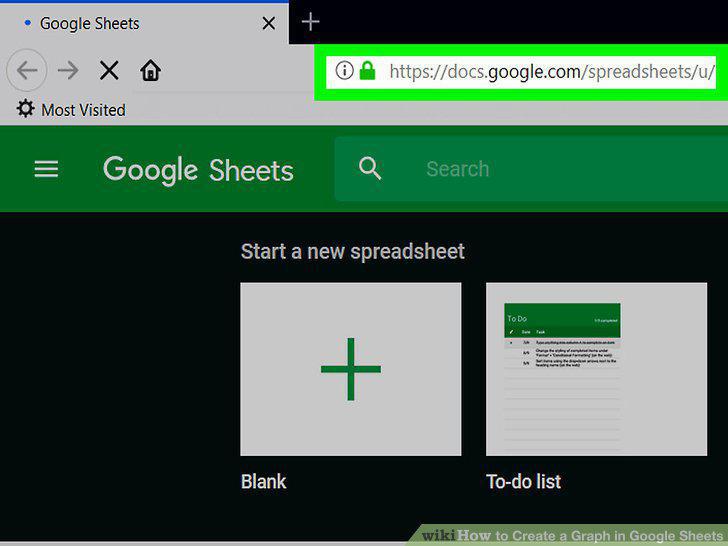
Open the Google Sheets page.
2
Click Blank.
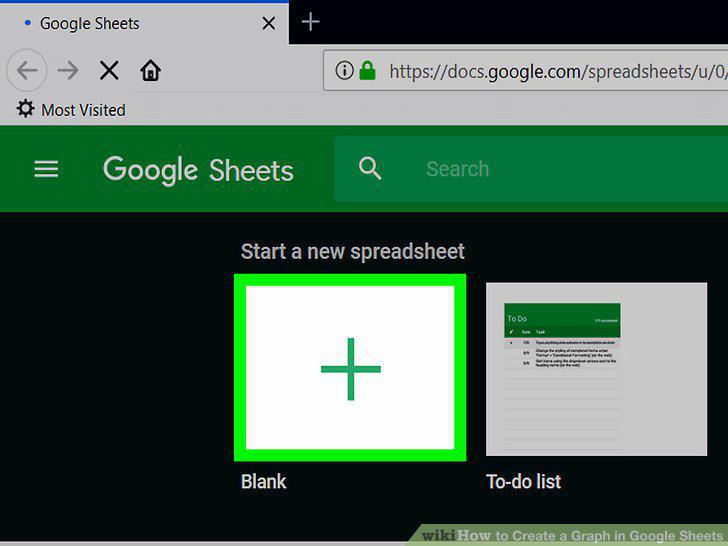
Click Blank.
3
Create your headers.
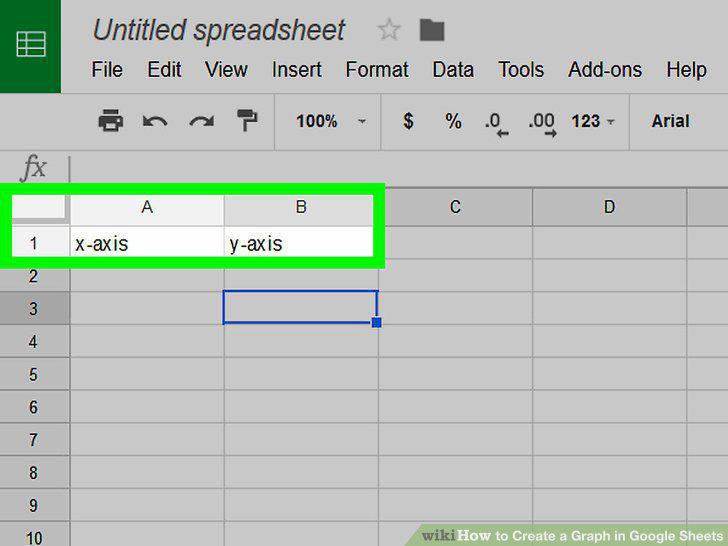
Create your headers.
4
Enter your data.
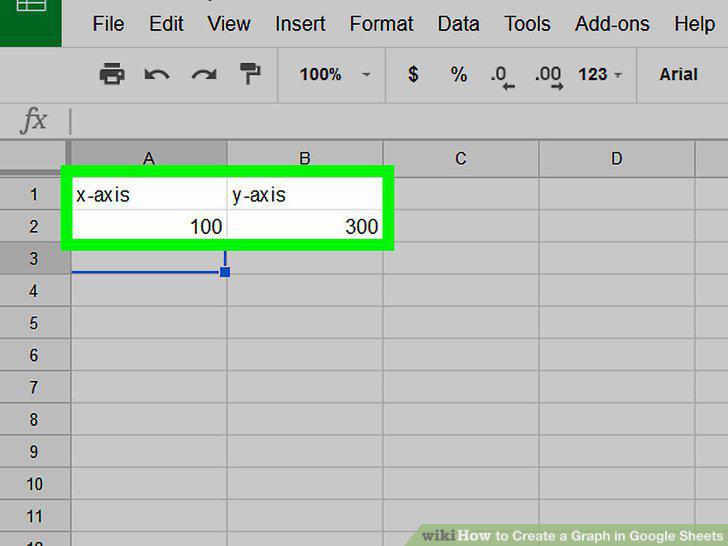
Enter your data.
5
Select your data.
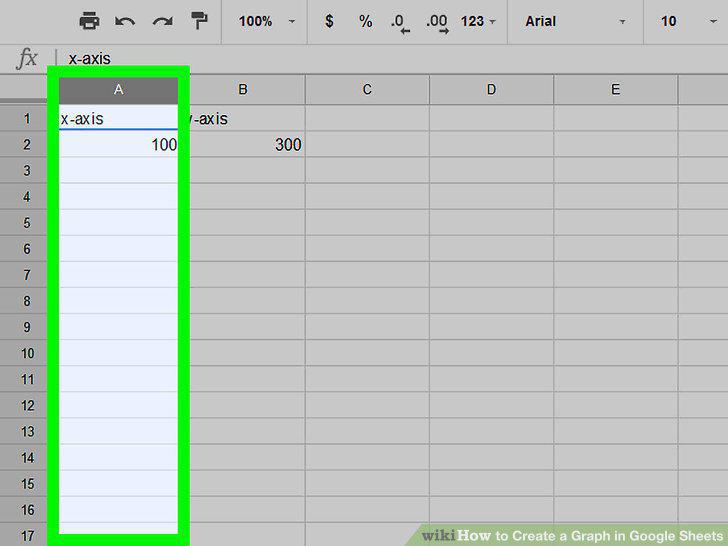
Select your data.
6
Click Insert.
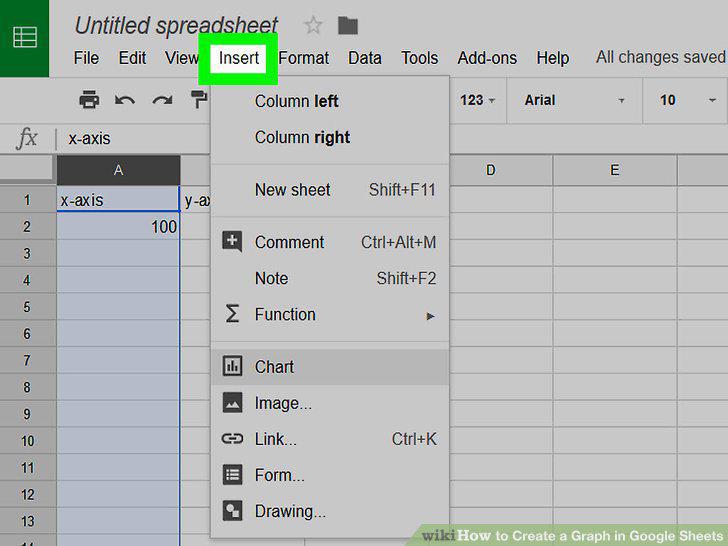
Click Insert.
7
Click Chart.
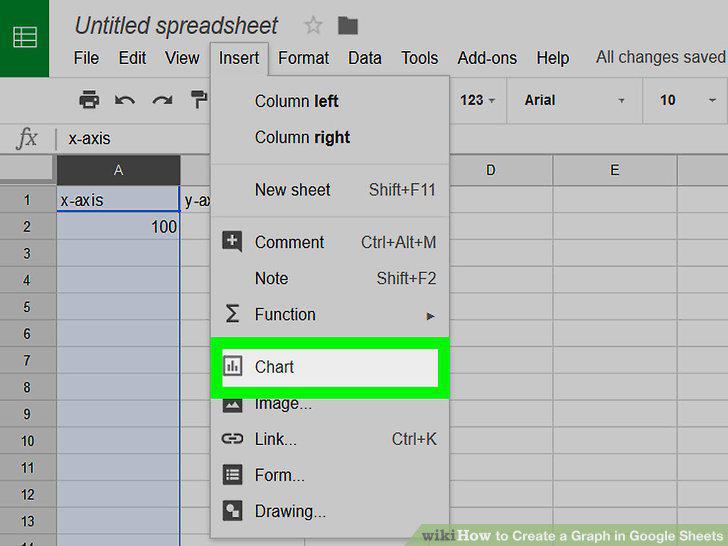
Click Chart.
8
Select a chart format.
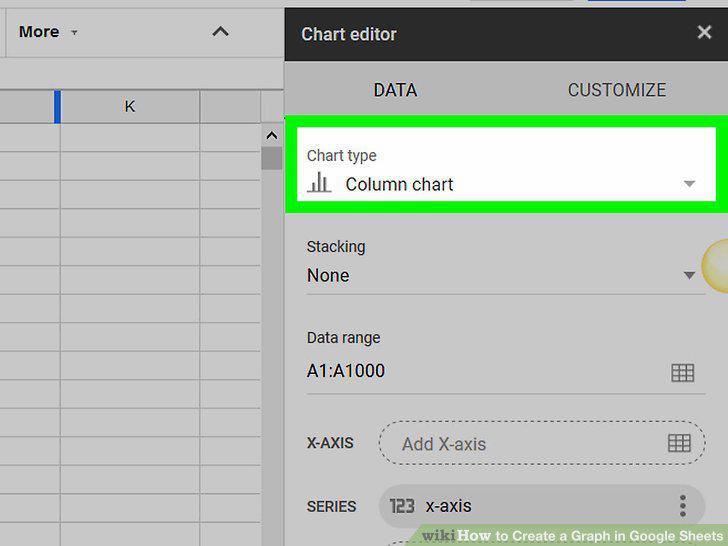
Select a chart format.
9
Share the graph.
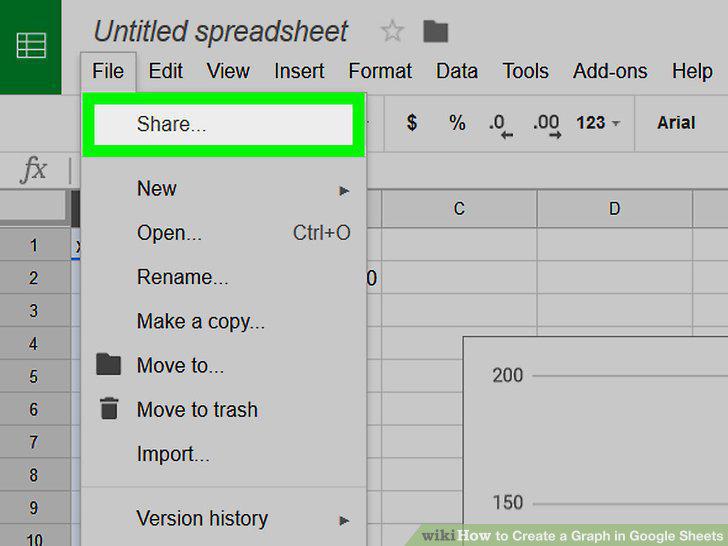
Share the graph.
Comments (0)
No comments yet. Be the first to share your thoughts!