How to Read a Psychrometric Chart
Look along the bottom of the chart to find the dry bulb temperature.. Find the humidity ratio labeled on the right vertical axis.. Locate the uppermost curved line on the chart to find the saturation curve.
Steps
Look along the bottom of the chart to find the dry bulb temperature.
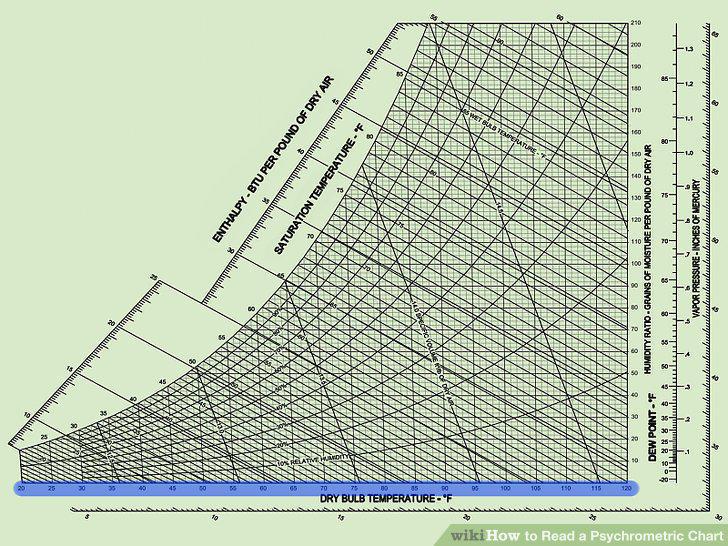
Look along the bottom of the chart to find the dry bulb temperature.
Find the humidity ratio labeled on the right vertical axis.
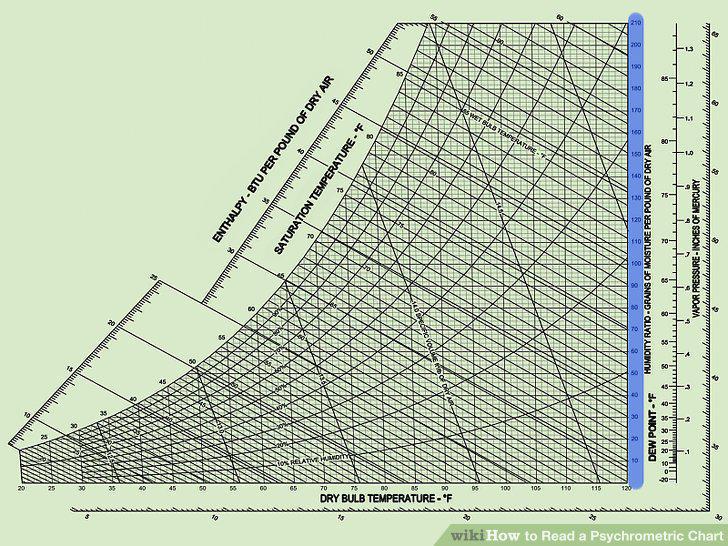
Find the humidity ratio labeled on the right vertical axis.
Locate the uppermost curved line on the chart to find the saturation curve.
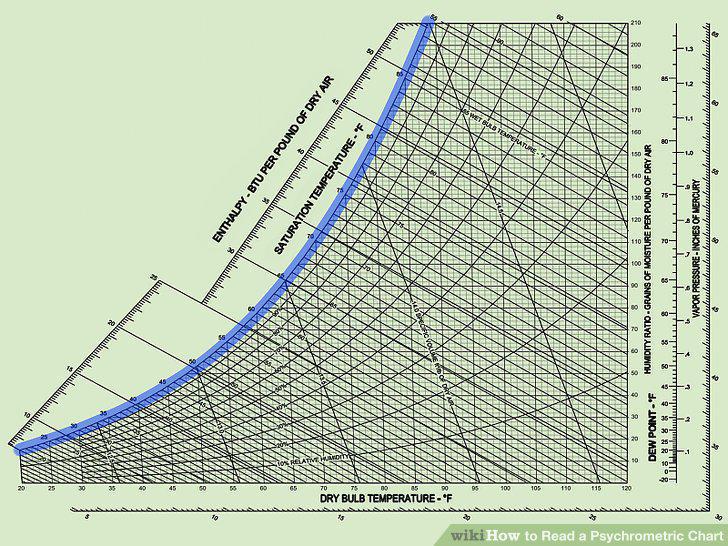
Locate the uppermost curved line on the chart to find the saturation curve.
Follow the interior curved lines to see various levels of relative humidity.
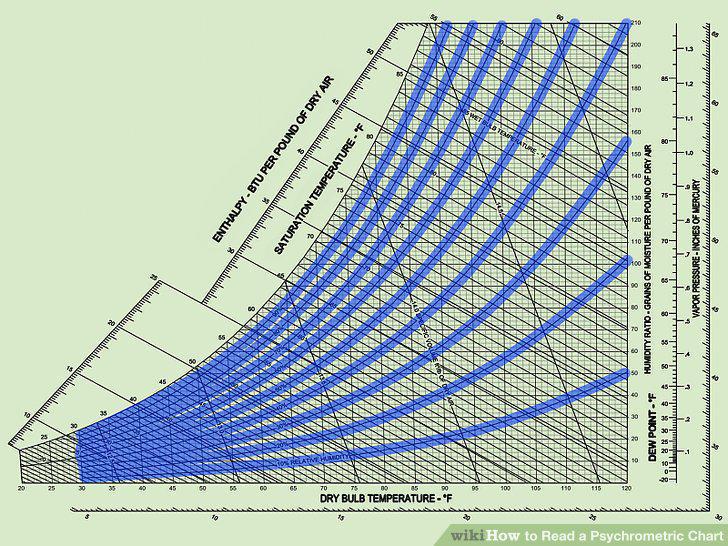
Follow the interior curved lines to see various levels of relative humidity.
Look on the right side of the chart to find the vertical dew point line.
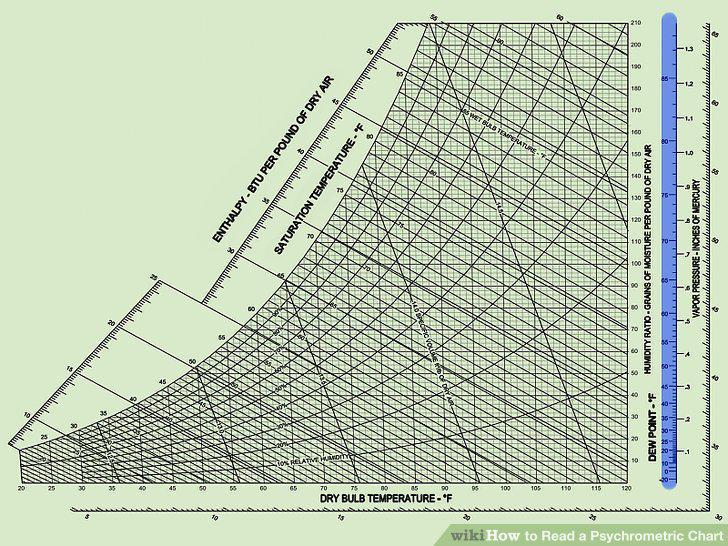
Look on the right side of the chart to find the vertical dew point line.
Locate the vapor pressure line to the right of the dew point line.
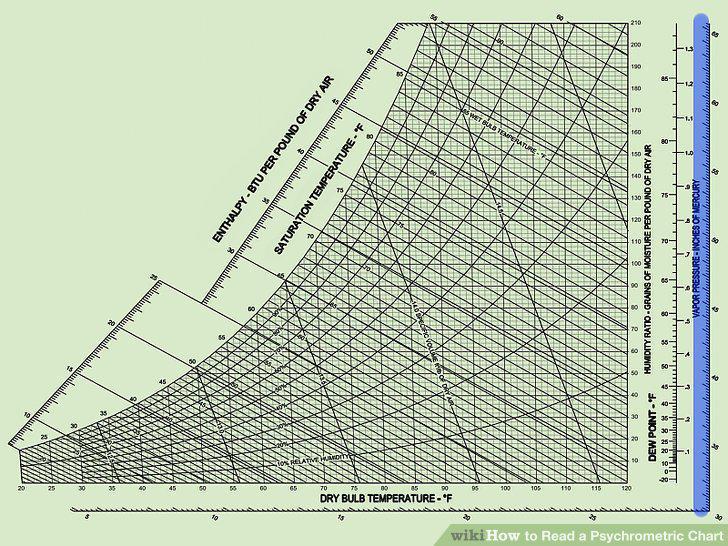
Locate the vapor pressure line to the right of the dew point line.
Identify the diagonal specific volume lines throughout the chart.
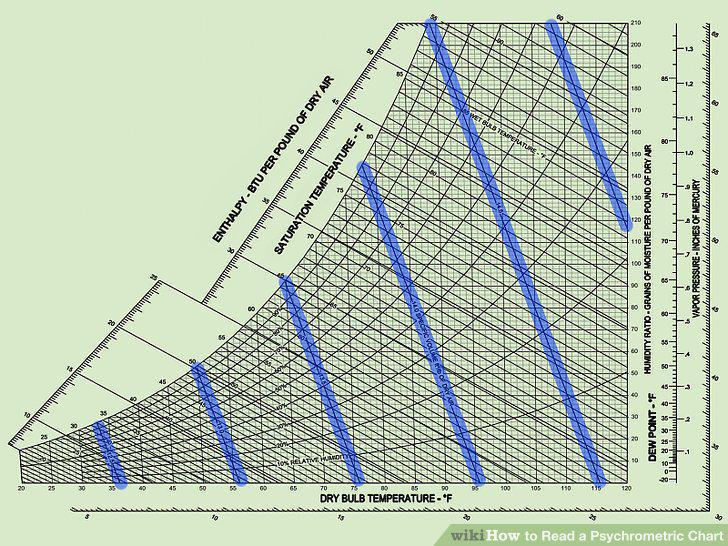
Identify the diagonal specific volume lines throughout the chart.
Find the diagonal enthalpy scales surrounding the chart.
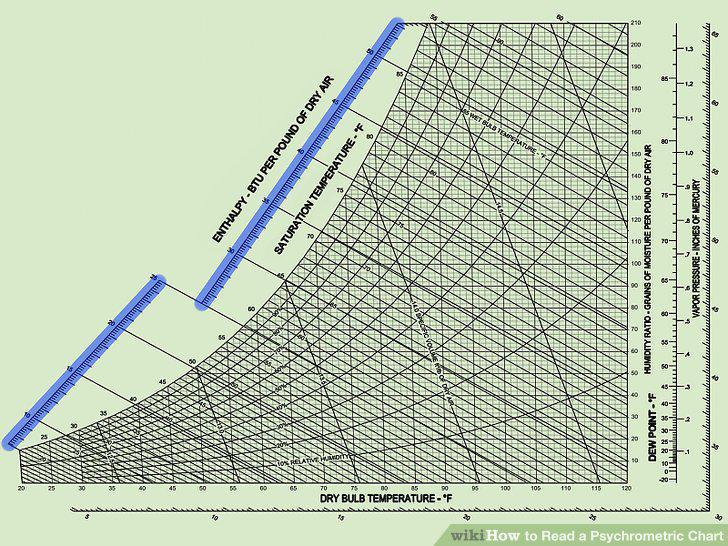
Find the diagonal enthalpy scales surrounding the chart.
Identify 2 known measurements that are on the chart.
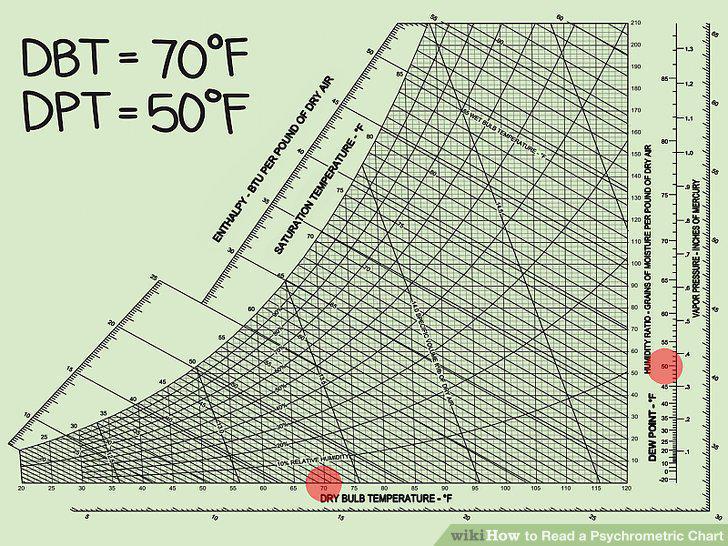
Identify 2 known measurements that are on the chart.
Use a ruler to locate other measurements at the point of intersection.
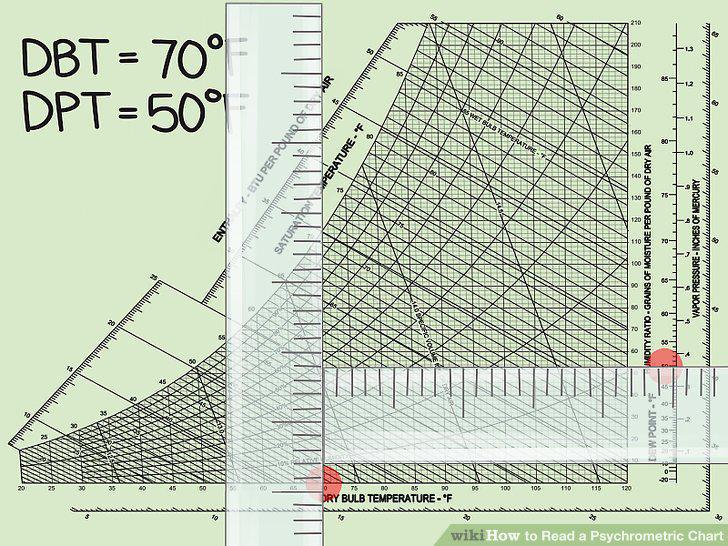
Use a ruler to locate other measurements at the point of intersection.
Visualize 2 measurements by comparing them on the chart.
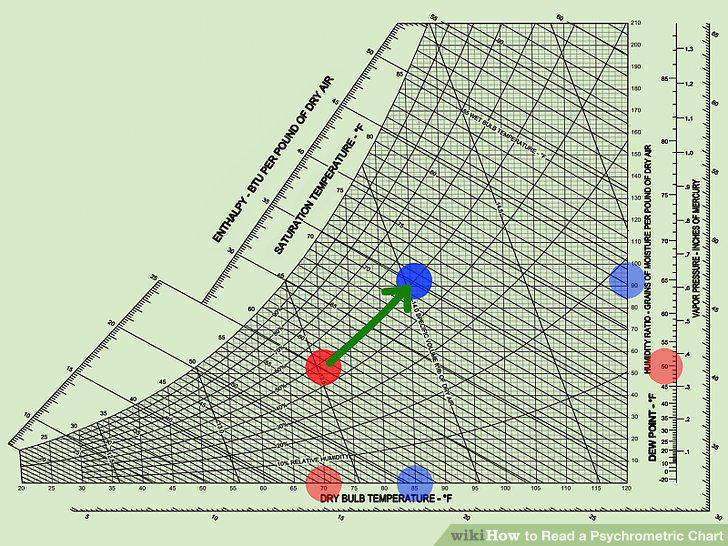
Visualize 2 measurements by comparing them on the chart.
Comments (0)
No comments yet. Be the first to share your thoughts!