How to Make a Scatter Plot
Choose your independent and dependent variables.. Draw an x-axis for the independent variable.. Add a y-axis for the dependent variable.
Steps
1
Choose your independent and dependent variables.
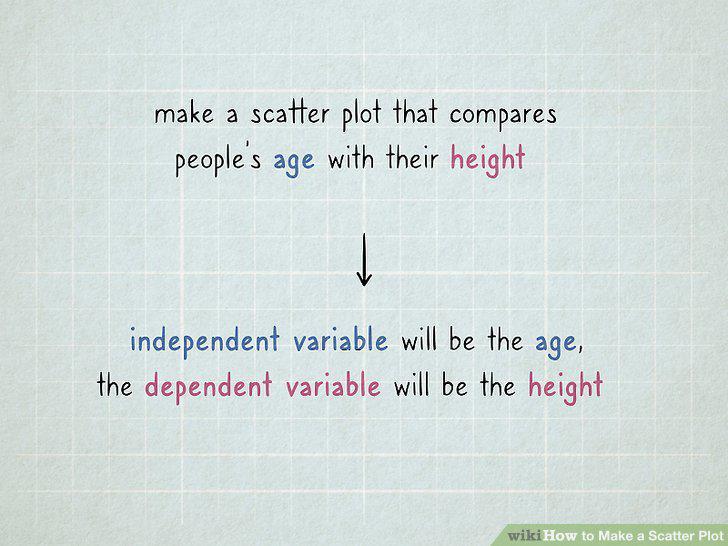
Choose your independent and dependent variables.
2
Draw an x-axis for the independent variable.
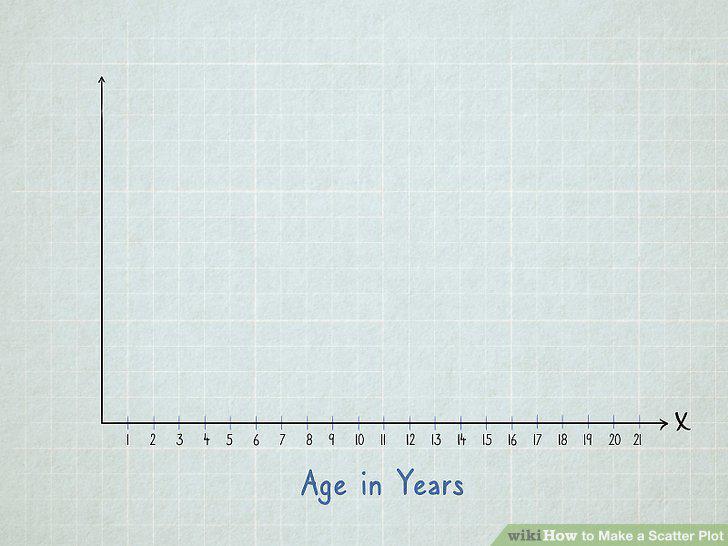
Draw an x-axis for the independent variable.
3
Add a y-axis for the dependent variable.
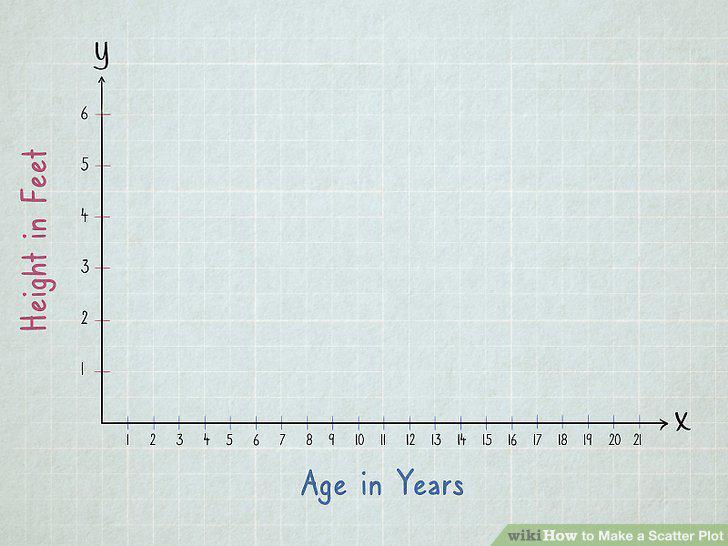
Add a y-axis for the dependent variable.
4
Mark each data point on your scatter plot.
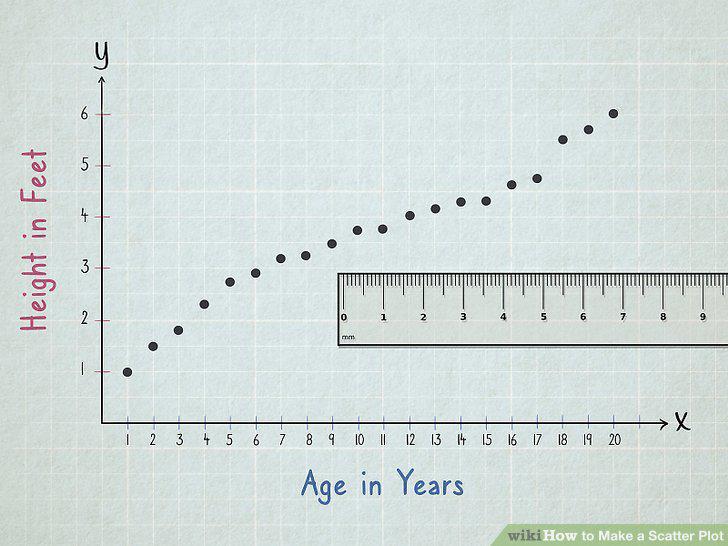
Mark each data point on your scatter plot.
5
Label your graph and your axes.
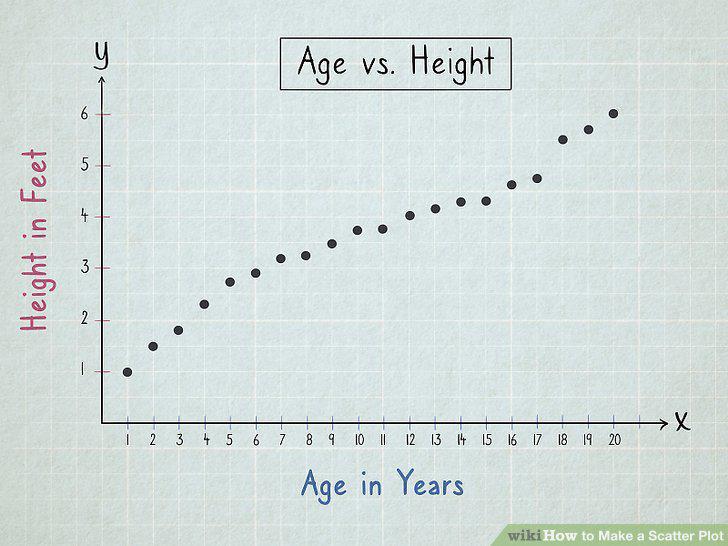
Label your graph and your axes.
6
Pick your independent and dependent variables.
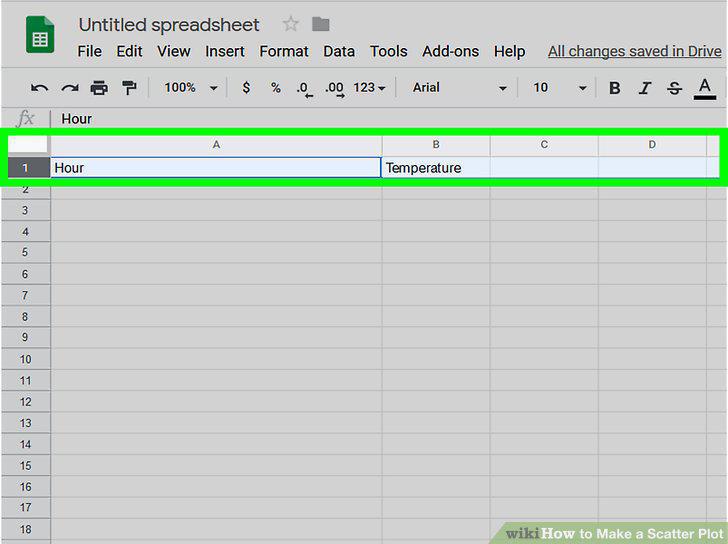
Pick your independent and dependent variables.
7
Input the variables into your spreadsheet.
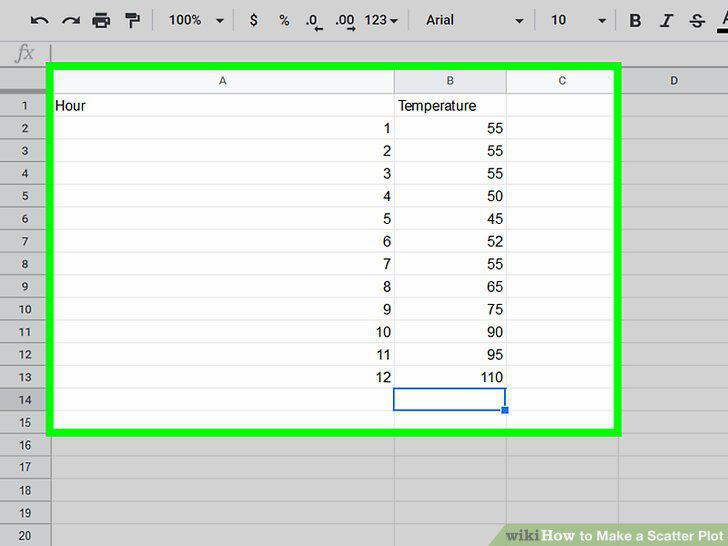
Input the variables into your spreadsheet.
8
Select your data and "insert" a scatter plot in Microsoft Excel.
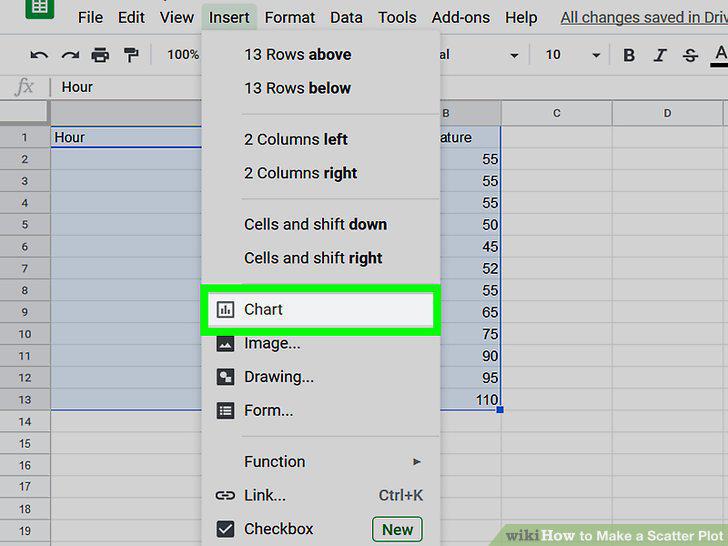
Select your data and "insert" a scatter plot in Microsoft Excel.
9
Insert a chart and customize it if you're using Google Sheets.
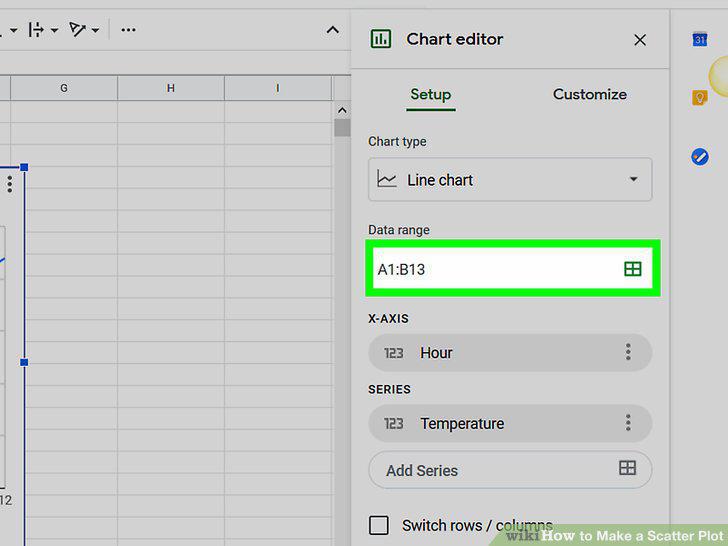
Insert a chart and customize it if you're using Google Sheets.
10
Use the customization options to change the look of your scatter plot.
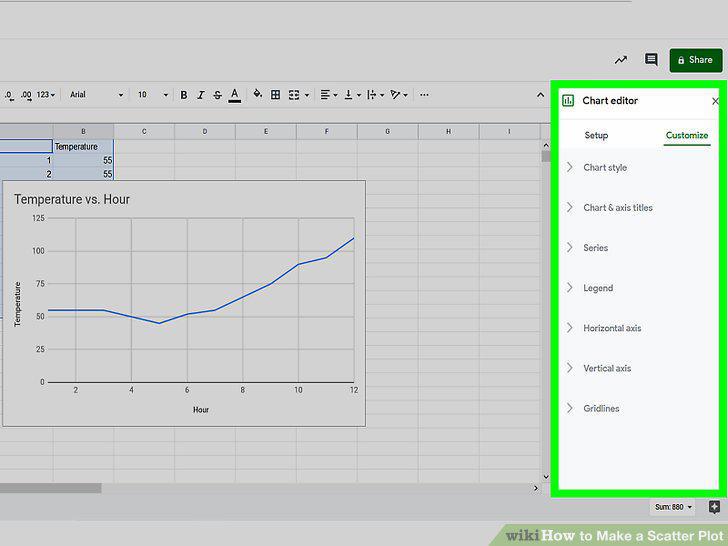
Use the customization options to change the look of your scatter plot.
Comments (0)
No comments yet. Be the first to share your thoughts!