How to Create a Waterfall Chart in Excel on PC or Mac
Open the spreadsheet with the data you want to graph.. Select the data you want to include in the graph.. Click the Insert menu.
Steps
1
Open the spreadsheet with the data you want to graph.
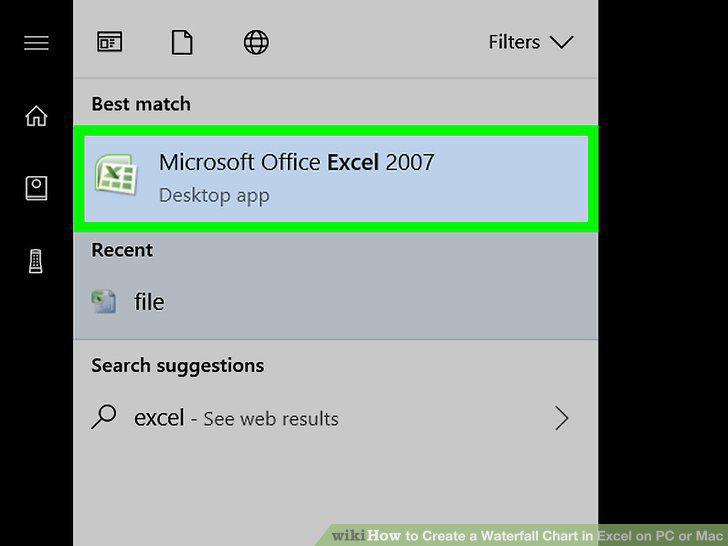
Open the spreadsheet with the data you want to graph.
2
Select the data you want to include in the graph.
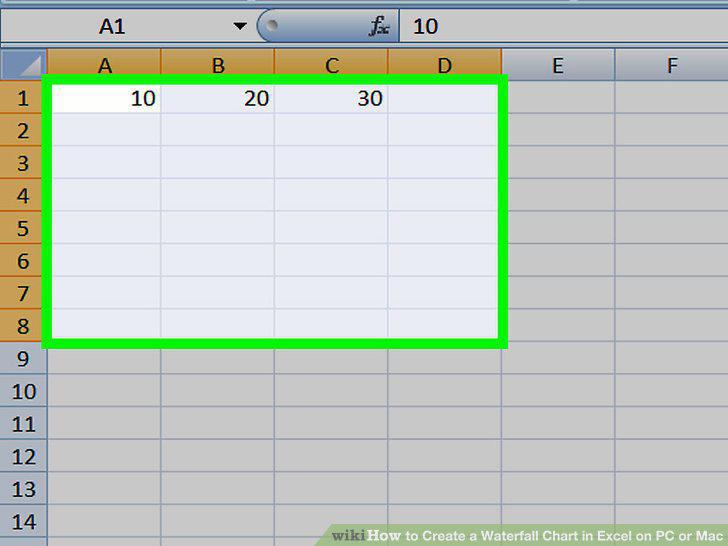
Select the data you want to include in the graph.
3
Click the Insert menu.
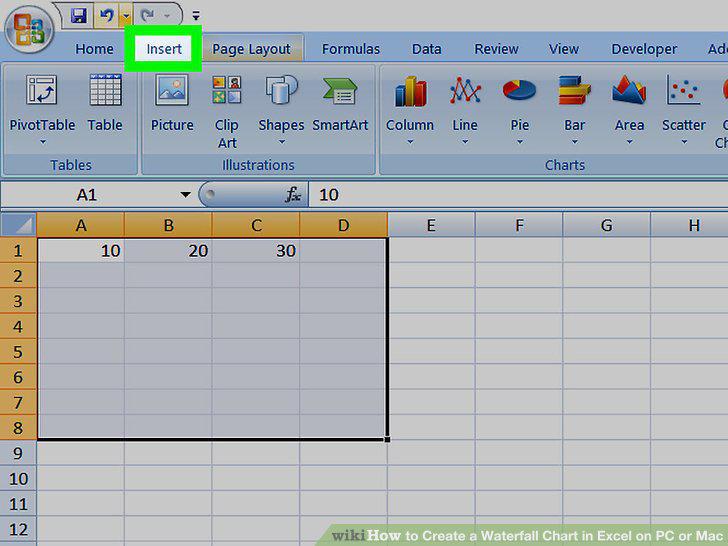
Click the Insert menu.
4
Click the Waterfall Chart icon.
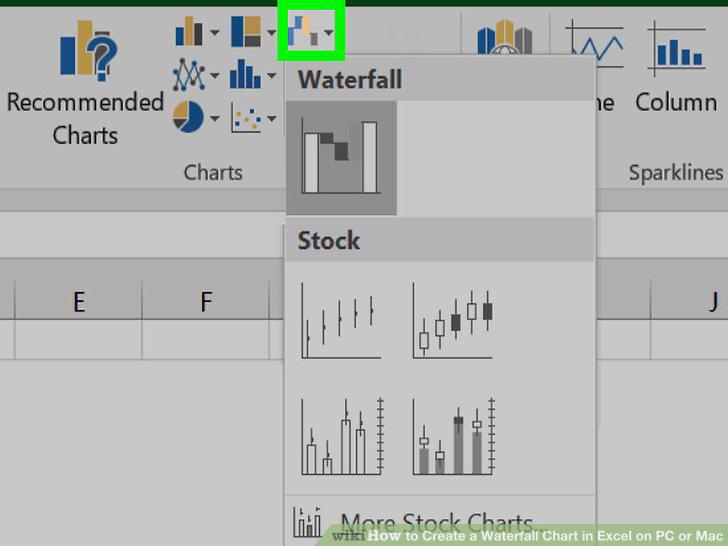
Click the Waterfall Chart icon.
5
Click the Waterfall Chart icon under the "Waterfall" header.
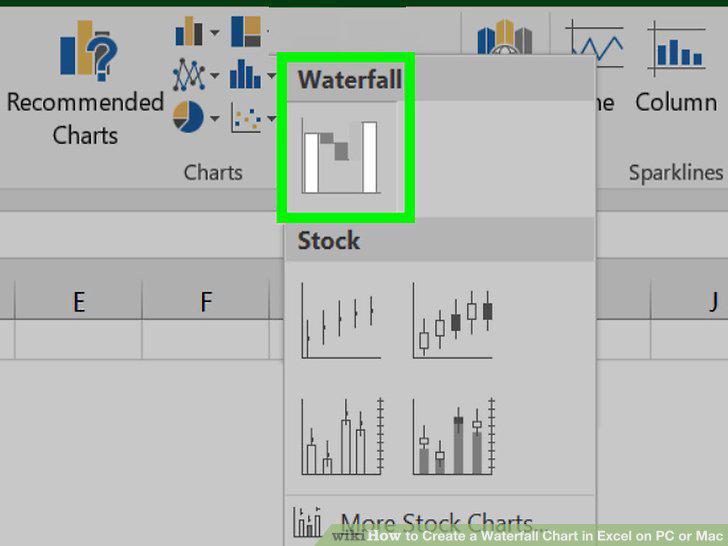
Click the Waterfall Chart icon under the "Waterfall" header.
6
Drag the chart to the desired location.
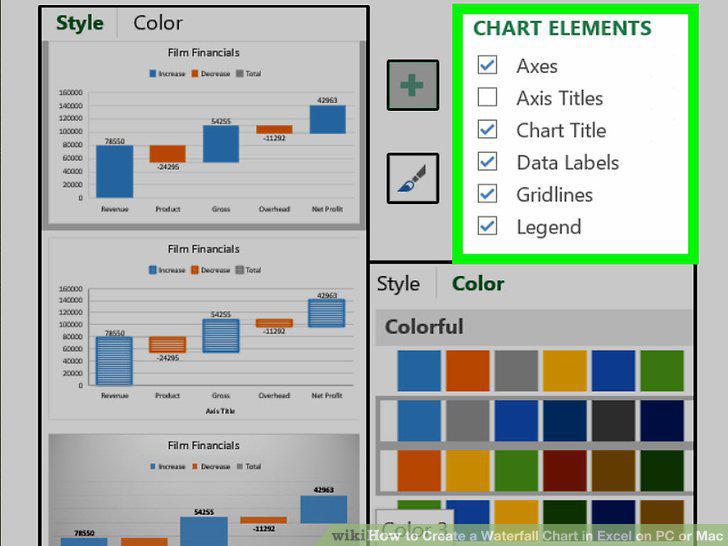
Drag the chart to the desired location.
Comments (0)
No comments yet. Be the first to share your thoughts!