How to Create an S Curve Pattern in Microsoft Excel
Enter your chart data.. Highlight the data.. Click the Insert tab.
Steps
1
Enter your chart data.
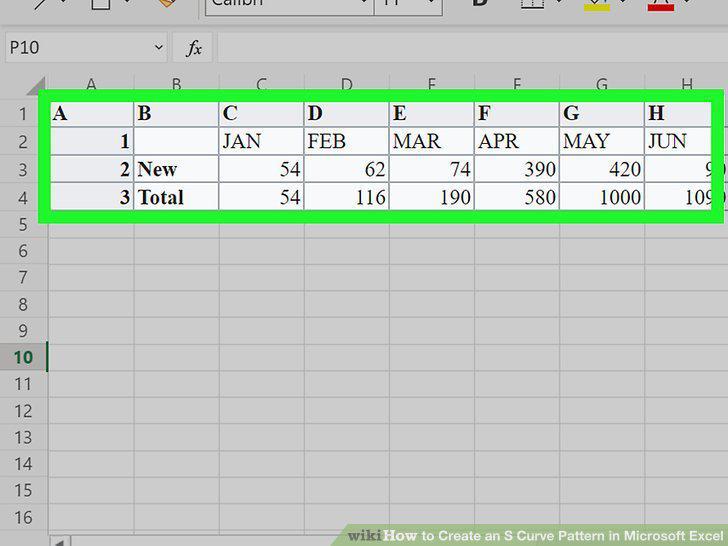
Enter your chart data.
2
Highlight the data.
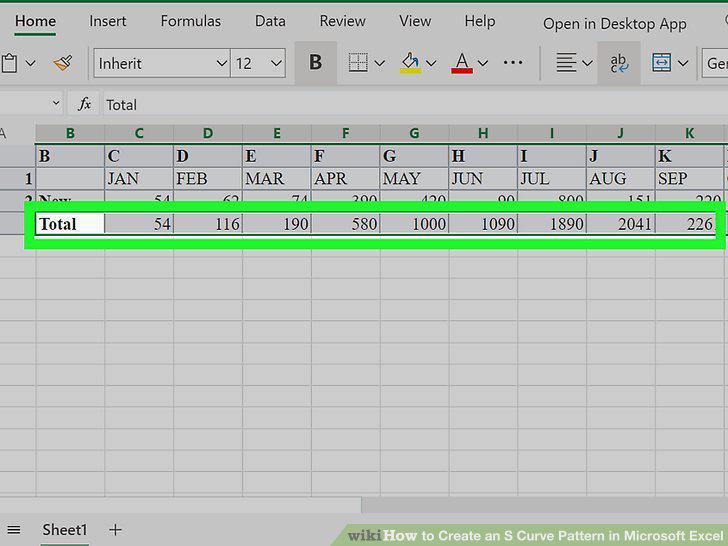
Highlight the data.
3
Click the Insert tab.
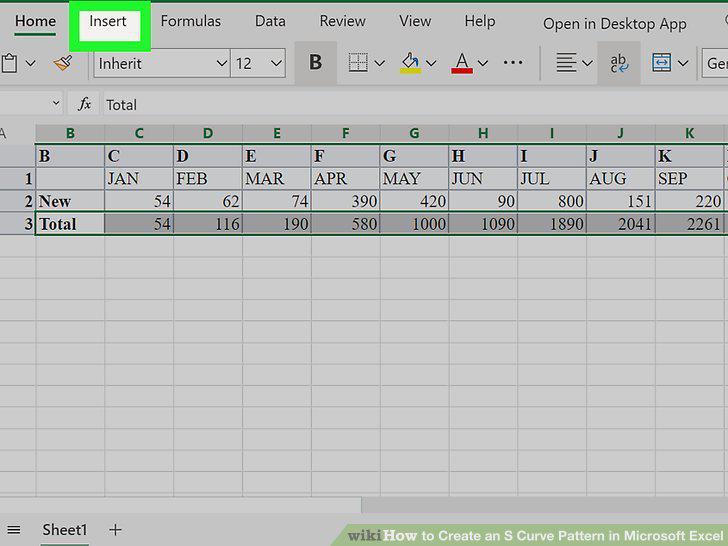
Click the Insert tab.
4
Select a chart type.
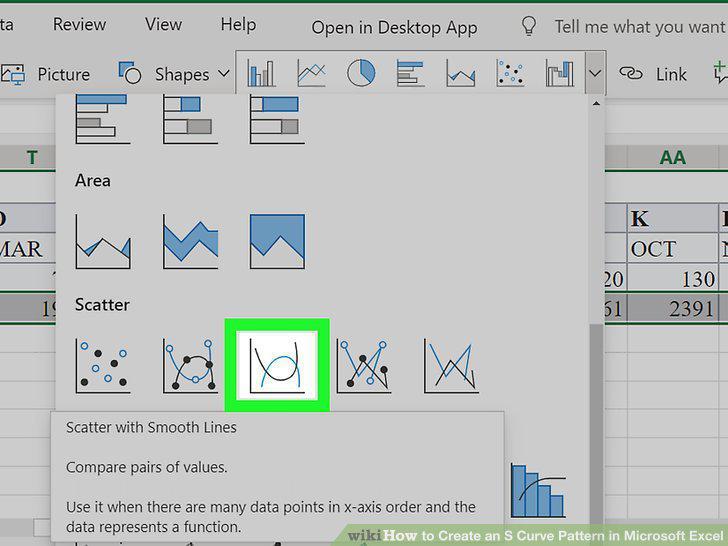
Select a chart type.
5
Customize your chart.
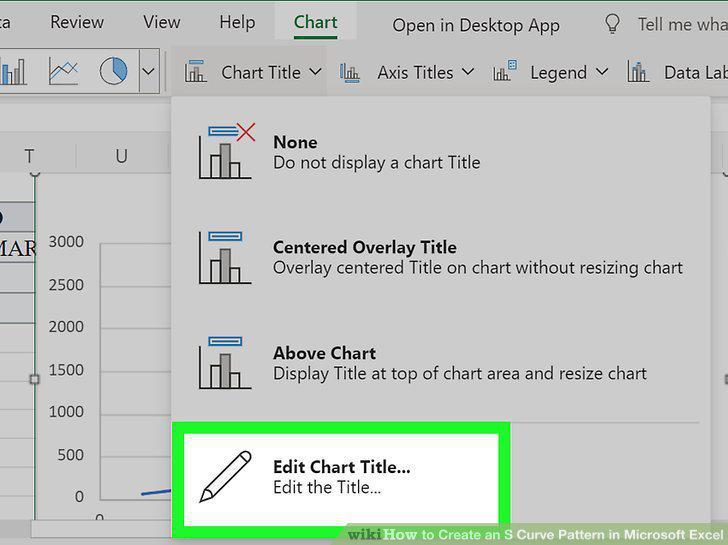
Customize your chart.
Comments (0)
No comments yet. Be the first to share your thoughts!