How to Make a Bar Graph in Excel
Open Microsoft Excel.. Click Blank workbook (PC) or Excel Workbook (Mac).. Add labels for the graph's X- and Y-axes.
Steps
1
Open Microsoft Excel.
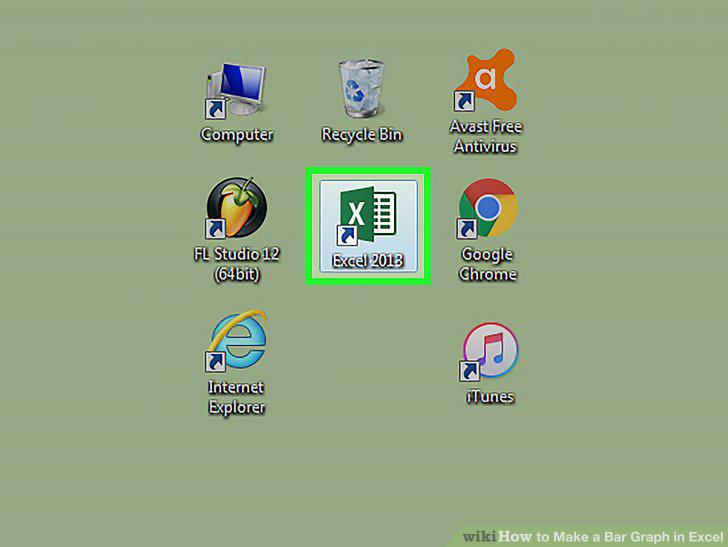
Open Microsoft Excel.
2
Click Blank workbook (PC) or Excel Workbook (Mac).
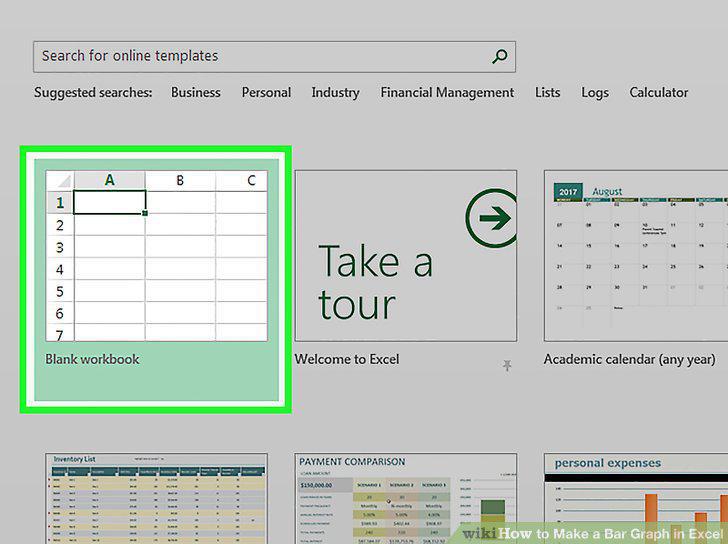
Click Blank workbook (PC) or Excel Workbook (Mac).
3
Add labels for the graph's X- and Y-axes.
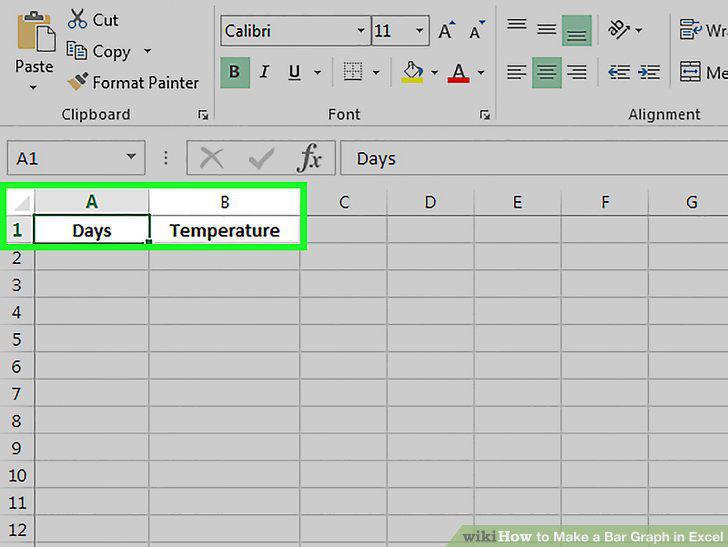
Add labels for the graph's X- and Y-axes.
4
Enter data for the graph's X- and Y-axes.
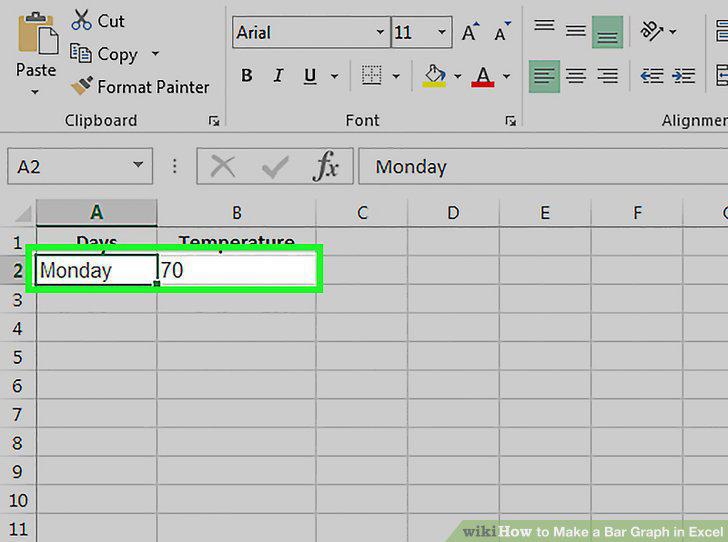
Enter data for the graph's X- and Y-axes.
5
Finish entering your data.
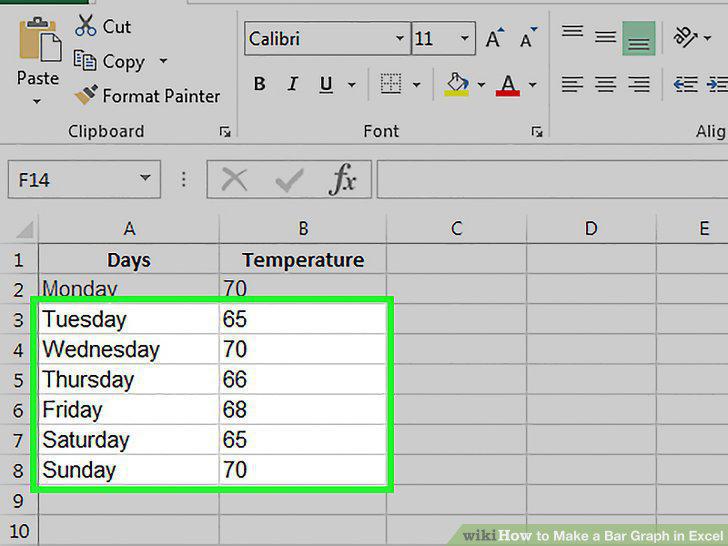
Finish entering your data.
6
Select all of your data.
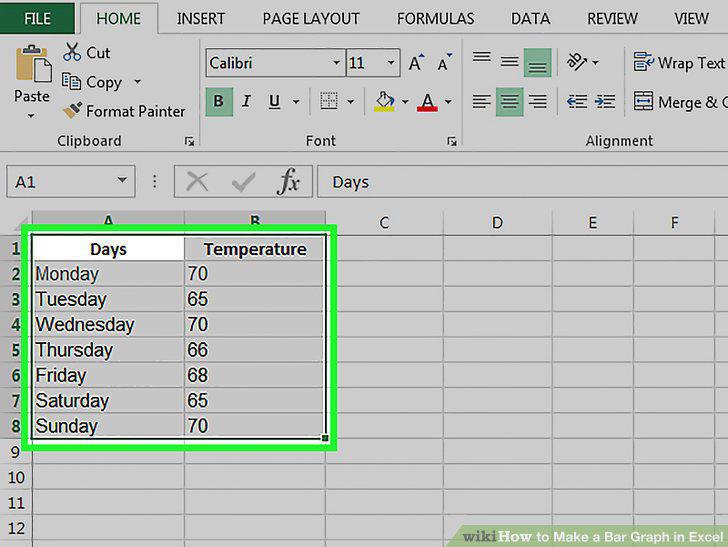
Select all of your data.
7
Click the Insert tab.
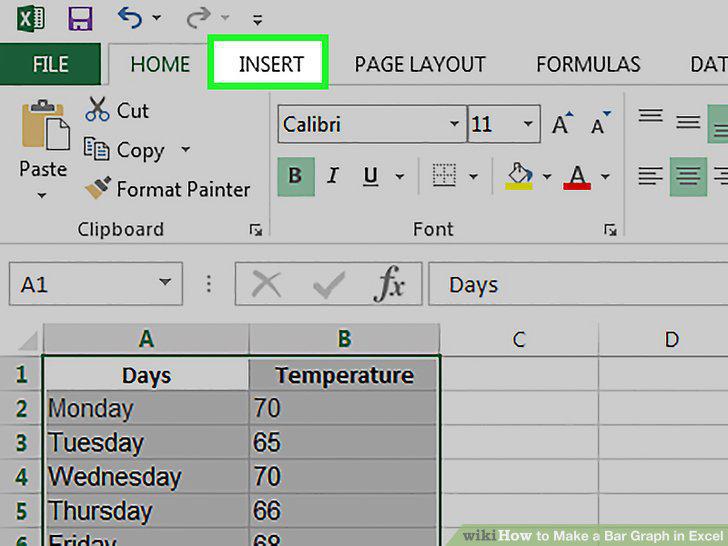
Click the Insert tab.
8
Click the "Bar chart" icon.
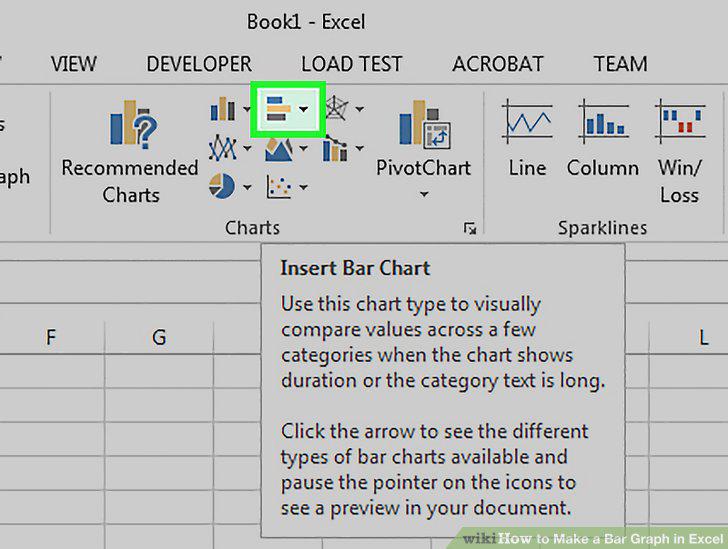
Click the "Bar chart" icon.
9
Click a bar graph option.
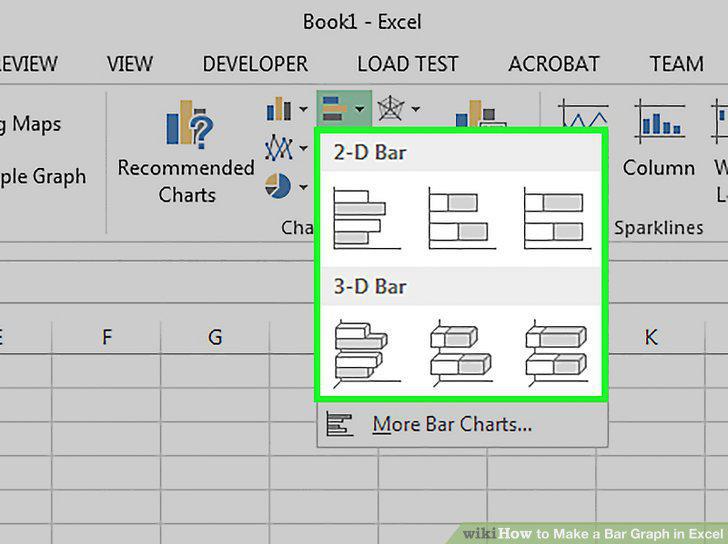
Click a bar graph option.
10
Customize your graph's appearance.
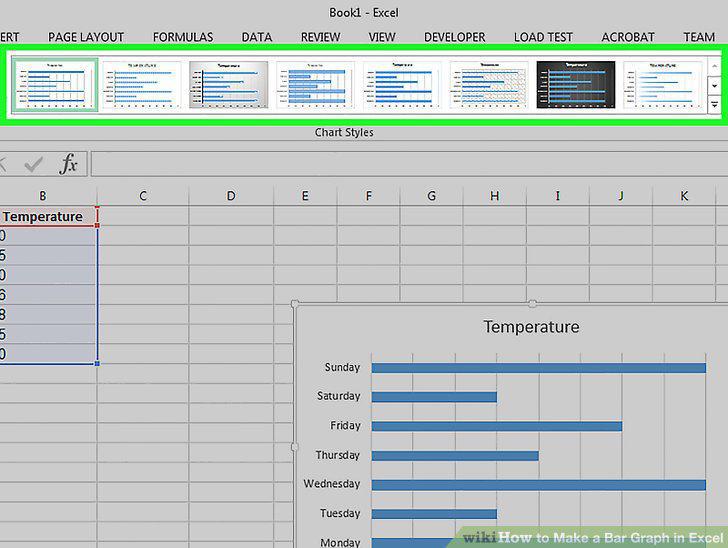
Customize your graph's appearance.
Comments (0)
No comments yet. Be the first to share your thoughts!